Previously we released an infographic detailing where students spend their money. As a follow up to that popular graphic, we decided to show family expenditure across a number of different variables between 2010 and 2012.
We looked at the average weekly spend of UK households (2010-2012), the weekly change in expenditure between 2011-2012, and the weekly household expenditure by region.
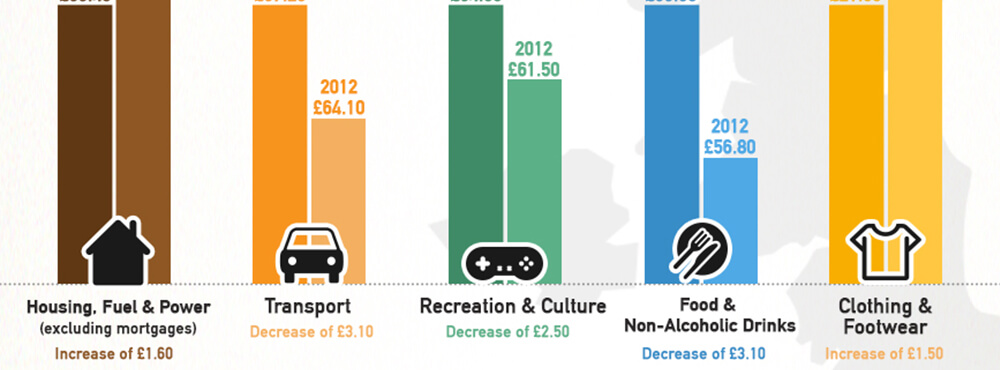
As you would expect, fuel, power usage and transport comes close to the top of the list of highest expenditure categories per week. On average people have spent less in 2012 on transport, recreation, food and non-alcoholic drinks than in 2011. London, The South East and the East of England are the areas that have the highest monthly expenditure, in contrast with Wales and the North East, who have the lowest.
Take a look at the rest of the information below;

Embed this Infographic in your Site:
Source: The Office for National Statistics.
